
Gantt
Source :
1. File Zul :
1.1. gantt_chart.zull
<vlayout apply="org.zkoss.bind.BindComposer" viewModel="@id('vm') @init('demo.chart.gantt.GanttChartVM')"> <chart id="chart" width="520" height="400" fgAlpha="255" paneColor="#ffffff" type="gantt" model="@bind(vm.model)" engine="@bind(vm.engine)" onClick="@command('showMessage',msg=event.areaComponent.tooltiptext)"/> <hlayout visible="@bind(not empty vm.message)"> You clicked on :<label value="@bind(vm.message)"/> </hlayout></vlayout>
1.2. gantt_chart_ctrl.zull
<vlayout apply="org.zkoss.bind.BindComposer"> <radiogroup onCheck="@global-command('configChanged', category=self.selectedItem.value)"> <vlayout> <radio label="Both Series" value="both" selected="true" /> <radio label="Scheduled" value="scheduled" /> <radio label="Actual" value="actual" /> <checkbox label="Percent Complete" onCheck="@global-command('configChanged', isComplete=self.checked)"/> </vlayout> <groupbox closable="false" sclass="z-demo-config"> <caption label="Theme" /> <hlayout> Choose : <listbox id="partSelect" mold="select" onSelect="@global-command('configChanged', colorSet=self.selectedItem.value)"> <listitem label="Customize 1" value="1" selected="true"/> <listitem label="Customize 2" value="2"/> <listitem label="Customize 3" value="3"/> </listbox> </hlayout> </groupbox> </radiogroup></vlayout>
2. View Model :
2.1. ganttchartVM.java
package demo.chart.gantt;import org.zkoss.bind.annotation.BindingParam;import org.zkoss.bind.annotation.Command;import org.zkoss.bind.annotation.GlobalCommand;import org.zkoss.bind.annotation.Init;import org.zkoss.bind.annotation.NotifyChange;import org.zkoss.zul.GanttModel;public class GanttChartVM { GanttModel model; GanttChartEngine engine; String message; String category; boolean complete; @Init public void init() { engine = new GanttChartEngine(); model = ChartData.getModel(category = "both", complete = false); } public GanttChartEngine getEngine() { return engine; } public GanttModel getModel() { return model; } public String getMessage() { return message; } @Command("showMessage") @NotifyChange("message") public void onShowMessage( @BindingParam("msg") String message){ this.message = message; } @GlobalCommand("configChanged") @NotifyChange({"model","engine"}) public void onConfigChanged( @BindingParam("category") String category, @BindingParam("isComplete") Boolean complete, @BindingParam("colorSet") Integer colorSet){ if(category!=null){ this.category = category; } if(complete!=null){ this.complete = complete; } if(category!=null || complete!=null){ this.category = category==null?this.category:category; this.complete = complete==null?this.complete:complete; model = ChartData.getModel(this.category, this.complete); } if(colorSet!=null){ engine.setColorSet(colorSet); } }}
2.2. ganttchartengine.java
package demo.chart.gantt;import java.awt.Color;import org.jfree.chart.JFreeChart;import org.jfree.chart.plot.CategoryPlot;import org.jfree.chart.renderer.category.GanttRenderer;import org.jfree.chart.renderer.category.GradientBarPainter;import org.jfree.chart.renderer.category.StandardBarPainter;import org.zkoss.zkex.zul.impl.JFreeChartEngine;import org.zkoss.zul.Chart;import demo.chart.ChartColors;/* * you are able to do many advanced chart customization by extending ChartEngine */public class GanttChartEngine extends JFreeChartEngine { public Color task1Color; public Color task2Color; public Color shadowColor; public Color completeColor; public Color incompleteColor; public boolean gradientBar = false; public GanttChartEngine(){ setColorSet(1); } public boolean prepareJFreeChart(JFreeChart jfchart, Chart chart) { if (task1Color == null) return false; CategoryPlot plot = (CategoryPlot) jfchart.getPlot(); GanttRenderer renderer = (GanttRenderer) plot.getRenderer(); renderer.setBarPainter(gradientBar ? new GradientBarPainter() : new StandardBarPainter()); renderer.setIncompletePaint(incompleteColor); renderer.setCompletePaint(completeColor); renderer.setShadowPaint(shadowColor); renderer.setSeriesPaint(0, task1Color); renderer.setSeriesPaint(1, task2Color); return false; } public void setColorSet(int value) { switch (value) { case 1: gradientBar = false; task1Color = new Color(0x083643); task2Color = new Color(0xB1E001); shadowColor = new Color(0x1D3C42); completeColor = new Color(0xCEF09D); incompleteColor = new Color(0x476C5E); break; case 2: gradientBar = false; task1Color = ChartColors.COLOR_2; task2Color = ChartColors.COLOR_3; shadowColor = ChartColors.COLOR_1; completeColor = ChartColors.COLOR_4; incompleteColor = ChartColors.COLOR_5; break; case 3: gradientBar = false; task1Color = new Color(0xADCF4F); task2Color = new Color(0xF2EC99); shadowColor = new Color(0x84815B); completeColor = new Color(0x4A1A2C); incompleteColor = new Color(0x8E3557); break; case 0: default: // Default Color task1Color = null; } }}
3. Model :
3.1. ChartData.java
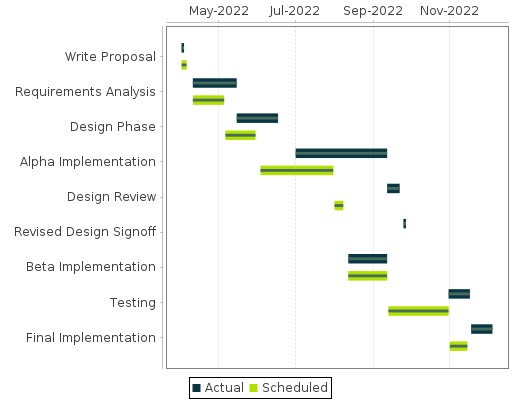
package demo.chart.gantt;import java.util.Calendar;import java.util.Date;import org.zkoss.zul.GanttModel;import org.zkoss.zul.GanttModel.GanttTask;public class ChartData { public static GanttModel getModel(String category, boolean complete) { GanttModel ganttmodel = new GanttModel(); int theYear = Calendar.getInstance().get(Calendar.YEAR); if ("both".equals(category) || "actual".equals(category)) { ganttmodel.addValue("Actual", new GanttTask("Write Proposal", date(theYear,4,1), date(theYear,4,3), complete ? 1.0 : 0.0)); ganttmodel.addValue("Actual", new GanttTask("Requirements Analysis", date(theYear,4,10), date(theYear,5,15), complete ? 1.0: 0.0)); ganttmodel.addValue("Actual", new GanttTask("Design Phase", date(theYear,5,15), date(theYear,6,17), complete ? 1.0: 0.0)); ganttmodel.addValue("Actual", new GanttTask("Alpha Implementation", date(theYear,7,1), date(theYear,9,12), complete ? 0.8: 0.0)); ganttmodel.addValue("Actual", new GanttTask("Design Review", date(theYear,9,12), date(theYear,9,22), complete ? 1.0: 0.0)); ganttmodel.addValue("Actual", new GanttTask("Revised Design Signoff", date(theYear,9,25), date(theYear,9,27), complete ? 1.0: 0.0)); ganttmodel.addValue("Actual", new GanttTask("Beta Implementation", date(theYear,8,12), date(theYear,9,12), complete ? 0.9: 0.0)); ganttmodel.addValue("Actual", new GanttTask("Testing", date(theYear,10,31), date(theYear,11,17), complete ? 0.8: 0.0)); ganttmodel.addValue("Actual", new GanttTask("Final Implementation", date(theYear,11,18), date(theYear,12,5), complete ? 0.8: 0.0)); } if ("both".equals(category) || "scheduled".equals(category)) { ganttmodel.addValue("Scheduled", new GanttTask("Write Proposal", date(theYear,4,1), date(theYear,4,5), 0.0)); ganttmodel.addValue("Scheduled", new GanttTask("Requirements Analysis", date(theYear,4,10), date(theYear,5,5), 0.0)); ganttmodel.addValue("Scheduled", new GanttTask("Design Phase", date(theYear,5,6), date(theYear,5,30), 0.0)); ganttmodel.addValue("Scheduled", new GanttTask("Alpha Implementation", date(theYear,6,3), date(theYear,7,31), 0.0)); ganttmodel.addValue("Scheduled", new GanttTask("Design Review", date(theYear,8,1), date(theYear,8,8), 0.0)); ganttmodel.addValue("Scheduled", new GanttTask("Revised Design Signoff", date(theYear,8,10), date(theYear,8,10), 0.0)); ganttmodel.addValue("Scheduled", new GanttTask("Beta Implementation", date(theYear,8,12), date(theYear,9,12), 0.0)); ganttmodel.addValue("Scheduled", new GanttTask("Testing", date(theYear,9,13), date(theYear,10,31), 0.0)); ganttmodel.addValue("Scheduled", new GanttTask("Final Implementation", date(theYear,11,1), date(theYear,11,15), 0.0)); } return ganttmodel; } private static Date date(int year, int month, int day) { final Calendar calendar = Calendar.getInstance(); calendar.set(year, month - 1, day); return calendar.getTime(); }}
3.2. ChartColor.java
Hasil :
Reference : https://www.zkoss.org/zkdemo/chart


